Stop Typing the Same Excel Formulas Repeatedly
The Hidden Cost of Repetitive Manual Data Work
How many times have you found yourself typing the same intricate formulas into Excel, week after week, month after month? Whether you're comparing as-built survey coordinates to design specifications, reconciling financial reports, or tracking inventory across multiple systems, the scenario is painfully familiar. You know the exact sequence, the precise cell references, and the common pitfalls. Yet, each time, you painstakingly recreate the same logic, hoping to avoid a typo or a misplaced bracket.
This isn't just a minor annoyance; it’s a significant drain on your time, resources, and ultimately, your business's bottom line. Manual data entry and repetitive spreadsheet manipulation are rife with hidden costs:
- Time Sink: Hours spent on data entry, formula creation, and meticulous error checking could be better spent on analysis, strategy, and decision-making.
- Error Prone: The human element means transcription errors, copy-paste mistakes, and forgotten updates are inevitable. A single misplaced digit or forgotten formula can ripple through your analysis, leading to inaccurate conclusions and costly rectifications.
- Inconsistent Data: When different teams or individuals handle data manually, it often leads to varying formats, conflicting versions, and a lack of standardisation. Trying to merge these disparate datasets into a coherent whole becomes a Herculean task.
- Data Silos: Many businesses struggle to combine information from different systems – a CRM, an ERP, a project management tool – because there's no easy, automated way to bring it all together. This creates "data silos" where valuable insights remain trapped.
- Delayed Insights: Slow, unreliable reporting based on inaccurate or incomplete data hinders timely decision-making. You're reacting to old news, rather than proactively steering your business.
Consider the specific example of an as-built survey. A professional meticulously measures the installed coordinates of piles and then needs to compare these against the original design coordinates. This requires calculating deviations – perhaps the delta in X, Y, and Z, or a comprehensive 3D distance out of position. For years, this meant typing in the same complex formulas repeatedly into Excel. Every new survey, every new project, demanded the same tedious setup. The thought of creating a master template was always there, but time pressures invariably meant just getting the job done, formula by formula, once again.
Beyond the Spreadsheet: A Glimpse into an Easier Future
Imagine the relief of finding a tool that understands your data's context without you having to explicitly tell it, one that streamlines those hours of repetitive formula entry into mere moments. This is precisely the experience that survey professional stumbled upon.
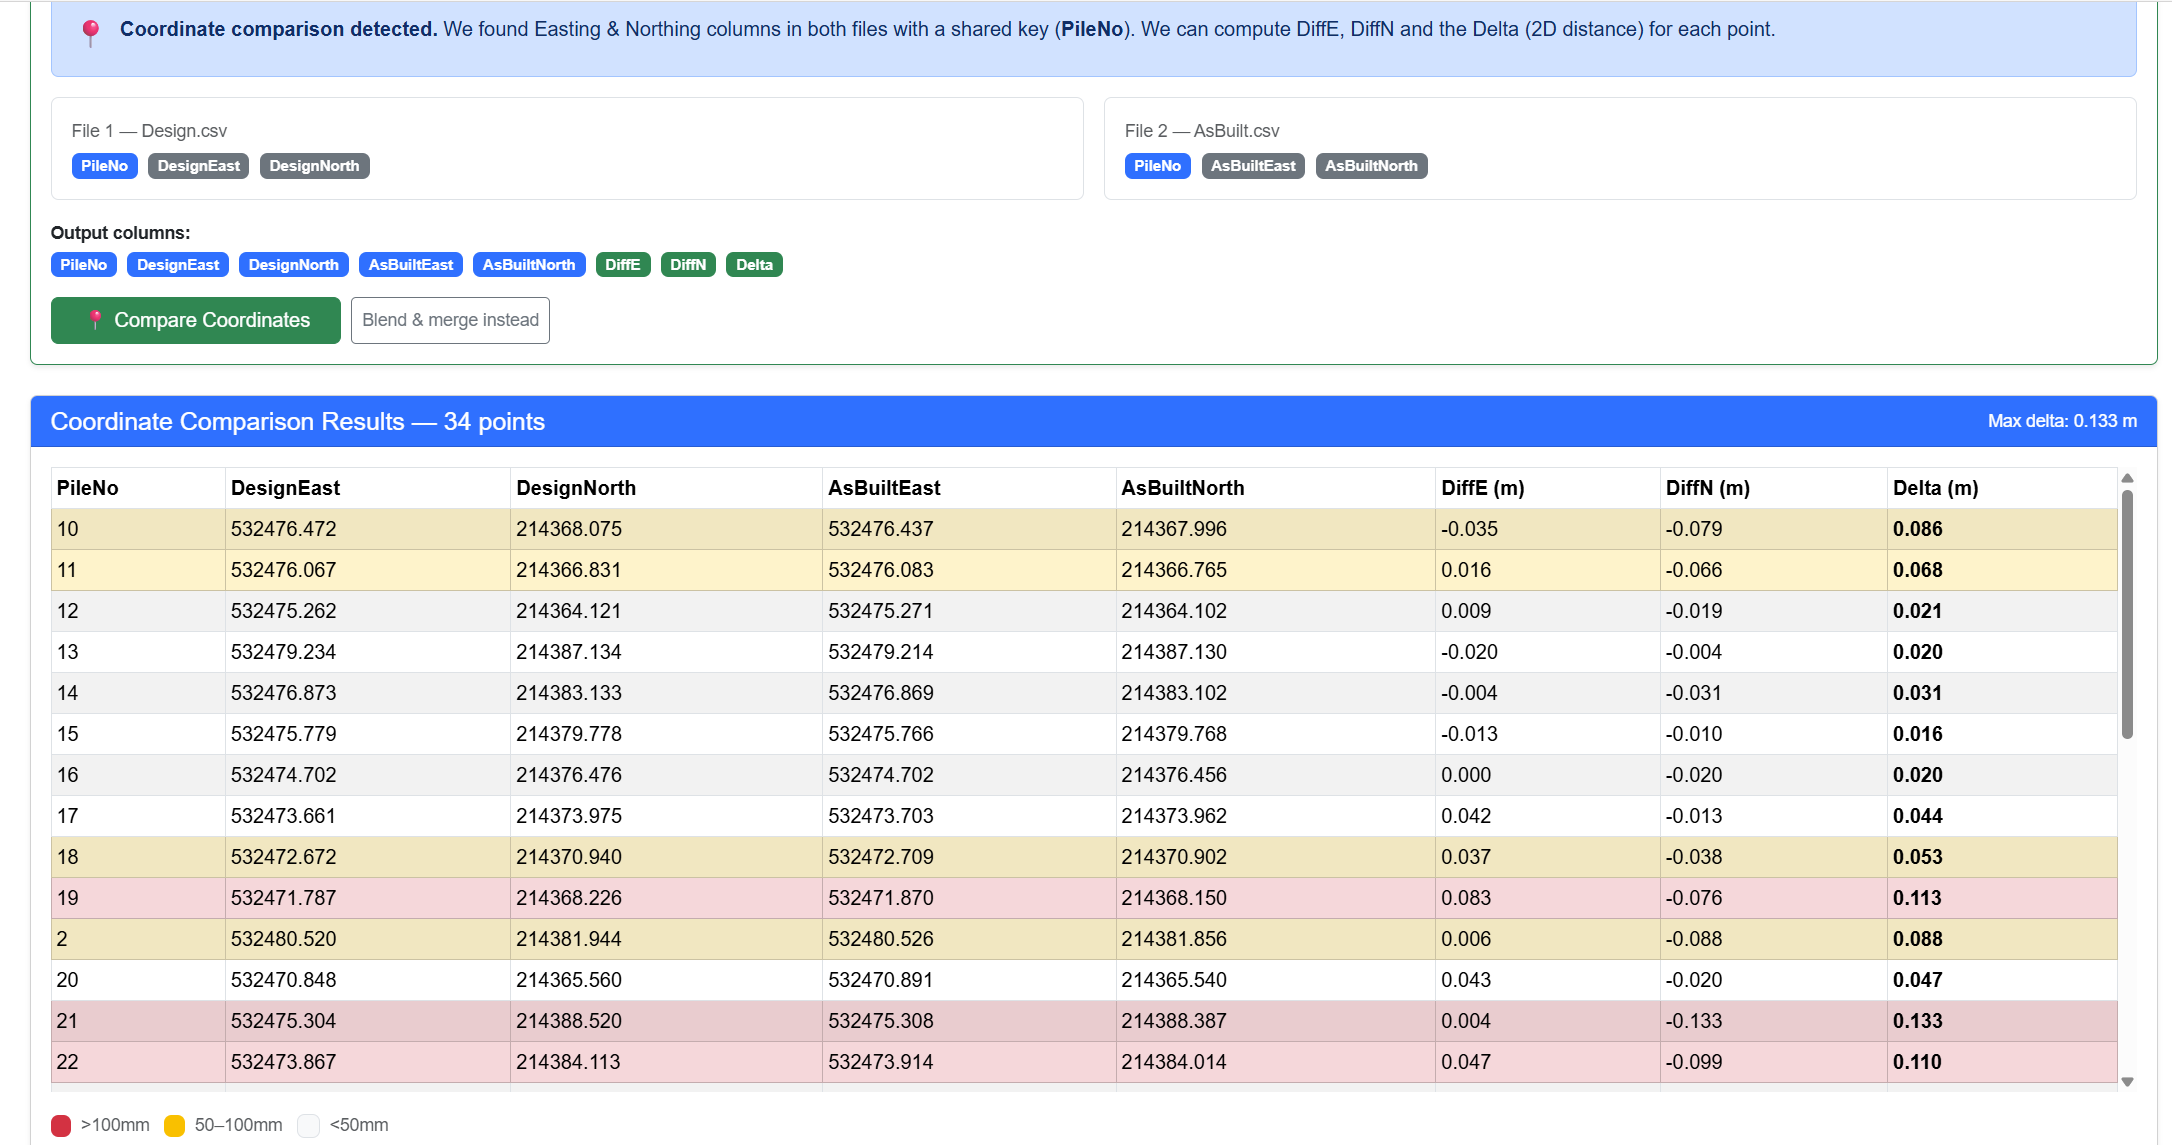
Tired of the perpetual grind of calculating discrepancies for their pile surveys, they decided to try something new, something that promised to tackle the very frustrations they faced daily. Instead of meticulously setting up templates and typing in those familiar formulas for distance out of position, they simply dragged their files directly into Smart Data Blender.
The results were genuinely surprising: not only did the platform intelligently recognise what the files were and automatically create a combined table of the values, but it went a step further. It even colour-coded the deviations, instantly highlighting which piles were significantly out of position. This wasn't just a time-saver; it was a revelation – an illustration of how things can be made incredibly easy when you have the right tools.
That specific experience isn't unique. Many professionals across various industries find themselves in similar situations, performing the same calculations, creating the same charts, and typing in the same formulas time and again. The belief that "this is just how it's done" or "it's too complex to automate" often keeps businesses locked into inefficient, error-prone cycles.
Why Manual Processes Persist (And Why They Shouldn't)
The inertia towards manual processes is understandable. Familiarity provides a sense of control, and the idea of adopting new software can seem daunting. There's often a perceived learning curve, a fear that the "fix" might be more complicated than the problem itself. However, clinging to outdated methods means missing out on significant opportunities for efficiency, accuracy, and strategic advantage.
The reality is, there is no longer a need to suffer through repetitive data work. The tools and technologies exist to transform these tedious tasks into streamlined, automated workflows. The 'easier way' isn't just a pipe dream; it's a tangible reality that can liberate your team from the drudgery of manual data handling.
Embracing Smarter Data Management
What does an "easier way" look like in practice? It involves leveraging intelligent data platforms that are designed to handle the complexities of multi-source data with minimal manual intervention:
- Automated Data Ingestion: Forget complex imports. Modern tools offer drag-and-drop functionality and automatic recognition of data types, headers, and structures, allowing you to bring in data from spreadsheets, databases, cloud services, and more with ease.
- Intelligent Data Blending: Seamlessly combine data from various sources without manual merging or complex VLOOKUPs. The system identifies commonalities and brings related data together, even if formats are slightly different.
- Instant Validation & Cleaning: Instead of manually scanning for errors, smart tools identify inconsistencies, duplicates, missing values, and formatting issues. Many even provide visual cues, like the colour-coding described earlier, to highlight critical deviations immediately.
- Pre-built Analytical Capabilities: Beyond simple combination, these platforms often come equipped with built-in functionalities to perform common comparisons, calculations (such as distance out of position for coordinates), and aggregations, reducing the need for custom formula entry.
- Visualisation & Reporting: Once blended and validated, data can be quickly transformed into clear, actionable visualisations, allowing for faster interpretation and more confident decision-making.
For those routinely grappling with the frustrations outlined above – be it comparing survey data, reconciling financial ledgers, auditing inventory, or tracking project progress – a tool like Smart Data Blender offers a clear path to efficiency. It's designed to take the drudgery out of combining, cleaning, and validating data from multiple sources, transforming hours of manual effort into minutes of automated insight. Its ability to intelligently recognise your data, blend it seamlessly, and even highlight critical deviations, much like the colour-coding feature that impressed our survey professional, is a testament to how modern solutions can simplify complex tasks and empower users.
Reclaim Your Time and Boost Your Accuracy
The experience of that survey professional serves as a powerful reminder: there are smarter, easier ways to manage your data. Stop letting repetitive data tasks drain your valuable time and resources. Take inspiration from others who have discovered a better way to handle their data, moving from tedious, error-prone manual work to efficient, insightful automation.
If you find yourself typing in the same formulas time after time, month after month, it's time to explore the alternatives. Try it with your data and see if it can help you transform your approach to data management.
Tired of doing this by hand?
Smart Data Blender does it automatically, in one click. Free trial, no card needed.
Try Smart Data Blender free